WORK

AFRICA's
Humanitarian crises
According to the UN in 2024 around 150 million people will need humanitarian assistane in Africa. Many of the problems Africa currently faces are underreported and are strongly related to population size and fertility rates. This cartogram explores this as part of infogr8's FutureFriday workshop.
#africa #populationsize #fertilityrates
#humanitariancrises
#UnitedNationsdata #futurefridays
#rawgraphs #cartogram

The last
UNDISPUTED
The heavyweight boxing era of the 90's was one of the most interesting times for (boxing) sports fans. With 5 different undisputed champions and many more top contenders understanding what happenend when can be confusing. This map visualizes and clarifies and shows additional information when opened in the interactive version here.
#boxing #undisputed #championship
#information design
#wikipediadata #sportsvizsunday
#tableau

WINDFINDER
Visualizing one year of wind, rain and temperature at Wijk aan Zee, The Netherlands 2021.
For kitesurfing some essential elements are wind, wind gust, winddirection, rain and temperature. This graphic visualizes these elements over one year at local spot Wijk aan Zee.
#private project
#data visualization
#KNMI #meteorological data
#static #print #made with tableau #Illustrator


MINDMAP
Visual index for a book about healthy eating and living. All elements in the infographic are chapters in the book and serve as a visual reference to the overal 'method' of the book.
#mindmap #infographic #print
ROUTES
Visualization of different educational routes for young people offered by the city of Amsterdam and government of The Netherlands.
#education #timelines #explainer


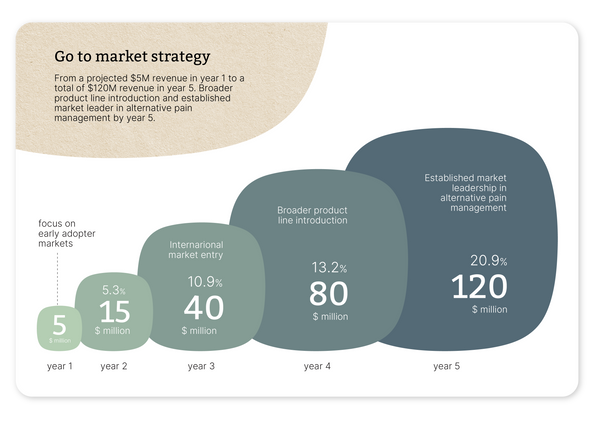
STARTUP PITCHDECK DESIGN


DASHBOARDS
Several data dashboards developed in Tableau showing campaign measurement data, sales funnel data and survey results dashboard
#dashboards #KPI's #Business intelligence


