
CASE STUDY | PERSONAL PROJECT
The Last Undisputed
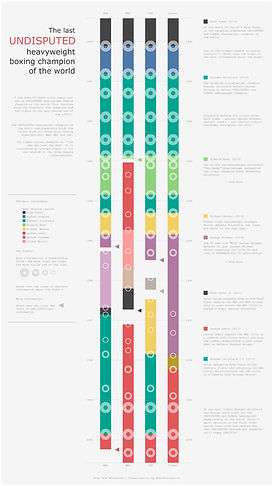
A visual timeline of boxing's heavyweight champions in the 1990s, how the titles changed hands, the rivalries and how one man became undisputed champion.
CLIENT
Personal Project
SCOPE
Data, Design, Dev
YEAR
2024
TOOLS
Illustrator, Tableau
01
THE PROJECT
The heavyweight boxing era of the 1990s was one of the most compelling in the sport's history — five different undisputed champions, and a cast of contenders that make it easy to lose track of what happened when.
Being undisputed meant holding all three major belts (WBA, WBC, IBF) at once; between 1993 and 2000, when Lennox Lewis reunified the titles, no single boxer held that position. This project visualizes that decade, showing who held which belt, when, and how the picture shifted.

02
DATA AND ANALYSIS
The project began as a personal one — a personal interest in boxing, and curiosity about the era when Mike Tyson was reclaiming his place as the sport's biggest name. A dataset covering champions, belts, and dates (sourced via SportsVizSunday) provided the backbone; Wikipedia supplied the additional context — fights, fighters, and events — needed to make the data legible.
03
DESIGN SYSTEM
With so much information available, the challenge was showing it in layers without overwhelming the viewer. Circles, coloured blocks, and arrows carry the core structure, while hovering reveals deeper context on demand — fight details, dates, and a fourth column tracking the separate Lineal championship ("the man who beat the man," independent of any organization). Built in Tableau, with the full interactive version on Tableau Public.


04
RESULTS
The finished piece turns a genuinely confusing decade of boxing history into something scannable at a glance, with hover interactions available for anyone who wants the full story. Shared as part of #SportsVizSunday, a showcase for the wider data visualization community.
